Toggle filters
    Photos
    Expand filters
    • Search by Image
    Reset color
    Toggle filters
    Photos
    Expand filters
    • Search by Image
    Reset color

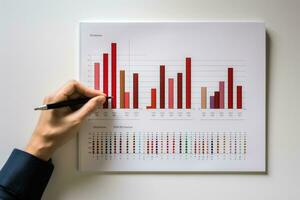
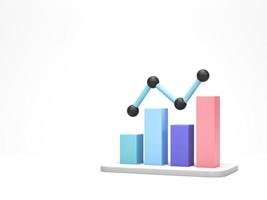
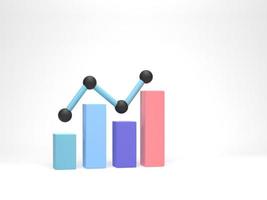
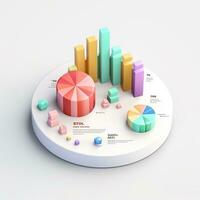
    Statistical Photos & Images

     - 21,779 high resolution, royalty free stock photos and pictures matching Statistical

    of 100
    • Magnifying glass on charts graphs paper. Financial development, Banking Account, Statistics, Investment Analytic research data economy, Stock exchange trading, Business office company meeting concept. photo
    • Statistics and data analysis. Investment. Business analysis using charts and graphs. Man studying statistics. Generated by artificial intelligence photo
    • Colorful data visualization with 3D bar graphs in shades of blue, orange, and purple, showcasing statistical trends. photo
    • A colorful 3d graphic of a bar graph photo
    • 3D rendering, 3D illustration. Business chart. Ascending graph for growth forward. Concept of economy graph, histograms, statistics photo
    • Marketer shows business growth graph, SEO ,optimization analysis tools, search engine rankings, social media sites based on results analysis data ,strategic planning ,Data statistical analysis photo
      Free
    • 3D rendering, 3D illustration. Business chart. Ascending graph for growth forward. Concept of economy graph, histograms, statistics photo
    • A pie chart with different colors photo
    • Ai generation 3d isometric business statistics, pie chart and graph. Financial and investment concepts photo
      Free
    • Vibrant Glowing Pie Chart in Dimly Lit Room for Business and Design Concepts photo
    • chart or graph paper. Financial, account, statistics and business data concept. photo
    • Colorful pie chart with data visualization for effective presentations and analysis. photo
    • Stethoscope on charts and graphs paper, Finance, Account, Statistics, Investment, Analytic research data economy and Business company concept. photo
      Free
    • Candlestick graph symbolizes stock market dynamics, guiding astute business decisions Vertical Mobile Wallpaper AI Generated photo
      Free
    • Chart graph paper. Finance, account, statistic, investment data economy, stock exchange business. photo
    • Statistics and data analysis. Investment. Business analysis using charts and graphs. Man making diagrams. Generated by artificial intelligence photo
      Free
    • Business professional analyzing graphs and charts for data-driven decision-making. photo
    • A blue pie chart with digital earth, 3d rendering. photo
    • Bar and pie graph isolated on white background, finance business. photo
    • Statistics and data analysis. Investment. Business analysis using charts and graphs. Man studying statistics. Generated by artificial intelligence photo
      Free
    • A green businessrelated line graph on an arrows background file format photo
    • An isolated red arrow cuts through a stack of papers, representing a dramatic decline in data or performance. The visual conveys urgency and loss in a stark yet impactful way. photo
    • Gaussian, bell or normal distribution curve and histogram graph on a naokin with coffee, business or science data analysis concept photo
    • AI generated Dynamic image of a bar chart where each bar is progressively higher, background image, generative AI photo
    • chart or graph paper. Financial, account, statistics and business data concept. photo
      Free
    • Digital lines made of numbers, globe big data background, 3d rendering photo
    • 3d rendering, graph chart background, business graph photo
    • Business Line graph photo
    • Ai generation 3d isometric business statistics, pie chart and graph. Financial and investment concepts photo
      Free
    • Ai generation 3d isometric business statistics, pie chart and graph. Financial and investment concepts photo
      Free
    • 3d rendering, graph chart background, business graph photo
    • Ai generation 3d isometric business statistics, pie chart and graph. Financial and investment concepts photo
      Free
    • Laptop screen in business office shows stock exchange values changing in real time, close up. Notebook in workplace with trading indexes showing prices and pie charts graphs, zoom in photo
    • Business Line graph photo
    • 3d rendering, curve lines with dark background photo
    • Colorful pie chart with six glossy segments showcasing data representation in a modern style. photo
    • 3d rendering, graph chart background, business graph photo
    • Ai generation 3d isometric business statistics, pie chart and graph. Financial and investment concepts photo
      Free
    • design data graphics photo
    • product chart data photo
    • Spreadsheet table paper. Finance development, Banking Account, Statistics Investment Analytic research data economy, trading, office reporting Business company concept. photo
    • Business Line graph photo
    • Colorful 3D pie chart on blue background. Perfect for visual data representation and infographic use photo
    • Spreadsheet paper with graph. Finance, Account, Statistics, Analytic research data economy, Stock exchange trading and Business company meeting concept photo
    • Luxurious modern office environment designed for business growth, enterprise workers can collaborate and analyze data on screens. Planning company development with cutting edge technology. photo
    • A colorful pie chart made of glossy, segmented pieces in vibrant shades, symbolizing data representation and analysis. photo
    • Vibrant 3D pie chart showcasing six segments in bold colors, symbolizing data and analytics. photo
    • Ai generation 3d isometric business statistics, pie chart and graph. Financial and investment concepts photo
      Free
    • Ai generation 3d isometric business statistics, pie chart and graph. Financial and investment concepts photo
      Free
    • businessman touching futuristic screen photo
    • Business performance graph with ballpoint pen photo
    • color data chart photo
    • Colorful 3D pie chart on red background. Perfect for visual data representation and infographic use photo
    • , stock market chart lines, financial graph on technology abstract background represent financial crisis, financial meltdown. Technology concept, trading market concept. photo
    • , stock market chart lines, financial graph on technology abstract background represent financial crisis, financial meltdown. Technology concept, trading market concept. photo
    • Business performance graph with pencil photo
    • A person holding a smartphone horizontally on the screen showing the cart image and the message online shopping, a concept image for use in online merchandising advertisements. copy space. photo
      Free
    • multicoloured pie chart 3d rendering on white background for business content. photo
    • , stock market chart lines, financial graph on technology abstract background represent financial crisis, financial meltdown. Technology concept, trading market concept. photo
    • visual data bar chart photo
    • quartiles box chart photo
    • Article in the financial newspaper. photo
    • Ai generation 3d isometric business statistics, pie chart and graph. Financial and investment concepts photo
      Free
    • Coronavirus pandemic statistics on screen photo
      Free
    • , stock market chart lines, financial graph on technology abstract background represent financial crisis, financial meltdown. Technology concept, trading market concept. photo
    • Significant growth trend up to 100 percent. Efficiency and productivity. Readiness progress. Strategic growth and operational excellence. Targeting up to 100 percent increases. photo
    • Business Line graph photo
    • 3d render SEO pie graph data an analytics. User interface for web banner and mock up. Business graph chart for future planning. Investment management and financial innovations. photo
    • graph on white photo
    • pie chart blue and white for business concept 3d rendering photo
    • Business Line graph photo
    • 3D rendering graph and pie chart. 3D illustration data concept on white background photo
    • Business financial report photo
    • Statistics and data analysis. Investment. Business analysis using charts and graphs. Man studying statistics photo
      Free
    • Shot of an dark mode excel sheet on computer screen showing bank loan amortization table. Banking photo
    • Coronavirus pandemic statistics on screen photo
      Free
    • Colorful pie chart showing market share growth photo
    • table with numbers printed on paper photo
    • Hologram information indicators over a person. Productivity and performance indicators. Personal qualities. Skills and abilities. Advantages and disadvantages. photo
    • Shot of an dark mode excel sheet on computer screen showing bank loan amortization table. Banking photo
    • Blue zigzag line rises on grid, indicating growth over time Vertical Mobile Wallpaper photo
    • Business financial report photo
    • Timely visuals Depicting business and stocks evolving performance graphically For Social Media Post Size AI Generated photo
      Free
    • Bar graph 3d on white background, finance business. photo
    • A bar graph with ascending bars in various colors sits on a desk with a line chart in the background photo
    • Bar Graph Strategy Concept on Green Pastel Background photo
    • Visual trends Graphs depict business, stock market performance, trends vividly For Social Media Post Size AI Generated photo
      Free
    • With the help of datadriven insights publishers are able to adapt their publication strategies in response to changing reader preferences resulting in a more dynamic and responsiv photo
    • Business chart concept photo
    • Pie Chart 3d Render photo
    • office details view photo
      Free
    • Miniature figures businessmen standing on a graph chart financial photo
      Free
    • Young asian businesswoman with chart isolated on white photo
      Free
    • analysis strategy study information business photo
      Free
    • stock market analysis screenshot photo
      Free
    • 3d render of futuristic retro landscape neon light on darkness background. Abstract Laser cyber lines show at night. Ultraviolet spectrum beam scene for mock up and web banner. photo
      Free
    • 3d render of futuristic retro landscape neon light on darkness background. Abstract Laser cyber lines show at night. Ultraviolet spectrum beam scene for mock up and web banner. photo
      Free
    • Visualizing change Blurred trading graph features percent symbol, depicting market dynamics For Social Media Post Size AI Generated photo
      Free
    • Business women holding documents photo
      Free
    • Scientific charts, cardiograms and mathematical calculations photo
      Free
    • Two businesspeople or an accountant team are analyzing data charts, graphs, and a dashboard on a laptop screen in order to prepare a statistical report and discuss financial data in an office
      Sponsored
    • Data analytics automated with AI technology. Big data, business analytics and artificial intelligence automation. Dashboard report with sales and operations charts and KPI insights on touch screen.
      Sponsored
    • Male coach hold seminar for staff, makes presentation, provides sales statistics explanation gathered in modern conference room, with monitor screen with infographic charts, graphs and diagrams data
      Sponsored
    • Data science and big data technology. Scientist computing, analysing and visualizing complex data set on computer. Data mining, artificial intelligence, machine learning, business analytics.
      Sponsored
    • Two diverse crypto traders brokers stock exchange market investors discussing trading charts research reports growth using pc computer looking at screen analyzing invest strategy, financial risks.
      Sponsored
    • Software, coding hologram and woman on tablet thinking of data analytics, digital technology and night overlay. Programmer or IT person in glasses on 3d screen, programming and cybersecurity research
      Sponsored
    • Diverse Office Conference Room Meeting: Successful Black Female Executive Director Presents e-Commerce Fintech Growth Statistics to a Group of Investors. Whiteboard with Big Data Analysis
      Sponsored
    • Business people, collaboration and paperwork with hands, statistics and social media trends. Office, writing and review of content creation team with SEO and target audience info for web update
      Sponsored
    Log In to Vecteezy
    or
    Reset Password
    Back to Log In →
    Single Sign-on

    Log in with your team's identity provider:

    ← Back to Log In