Toggle filters
1
    Vectors
    Expand filters
    • Search by Image
    Reset color
    Toggle filters
    Vectors
    Expand filters
    • Search by Image
    Reset color

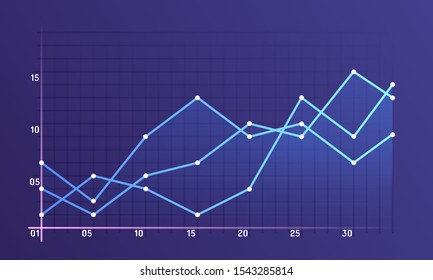
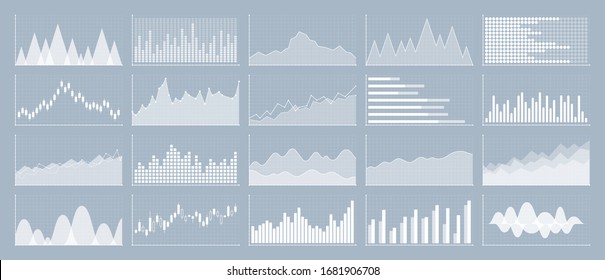
    Line Graph Background Vector Images

     - 47,039 royalty free vector graphics and clipart matching Line Graph Background

    of 100
    • Minimalist blueprint background featuring grid on graph paper. Repeating line pattern ideal for plans, study aids, or mockups. black and white illustration vector
    • Red abstract financial chart with uptrend line graph and numbers in stock market on gradient dark blue color background vector
      Free
    • Stock and investment concept. A bar and line graph on dark blue background. Burish market, profit of wealth, high-risk high return, business growth up. vector
    • abstract financial chart with uptrend line graph and numbers in stock market on gradient white color background vector
    • Abstract financial chart with uptrend line graph on black background. Vector illustration
    • Investment stock market graph. Growth business chart. Digital arrow report background. Graphic vector illustrator.
    • Abstract financial chart with arrow. Vector Illustration
      Free
    • an abstract background with a graph line vector
    • Chart stock market or forex trading graph in graphic concept need for financial investment or Economic trends of economics element vector
      Free
    • Light and dark background, Bitcoin crypto currency illustration vector for page, logo, card, banner, web and printing.
      Free
    • Graph technology background It is a technology that shows the price of growth within the company to understand the profit and loss of the company. Use the blue line to show the price. vector
    • business and finance concept. bar graph and candlestick chart with lines on blue background vector
    • Technology background showing stock price as a graph Used to measure the price of a company on the stock market to increase investors. Vector illustration of red and green line graph.back bar graph
    • stock illustration set collection abstract digital landscape particles stars background vector
      Free
    • Technology background with price charts used to measure the growth, profit, and loss of the company Vector illustration blue line graph Bar graph behind the world map
    • Economic critical crisis concept. The lower line graph and shiny on red background. Recession financial, cryptocurrency, gold, and the stock market. Losing money and cash. vector
    • Stock and investment concept. A bar and line graph on dark blue background. Burish market, profit of wealth, high-risk high return, business growth up. vector
    • background financial chart with line graph in stock market ultraviolet vector
    • Green up rising arrow path with blue, red, yellow support indicator arrows path with grey cyber elements template vector
    • Stock and investment concept. A bar and line graph on a dark blue background. Bullish market, profit of wealth, high risk high return, business growth up. vector
    • Analysis landing pages for finance and business vector
      Free
    • A bar and line graph on a dark blue background vector
    • Gradient Stock Market Concept Modern Financial Data Visualization and Trading Illustration vector
    • timeline digital concept with blue background. road map to success with pin pointers.road map timeline infographic.Timeline infographic 5 milestone like a road. vector
      Free
    • Business candle stick graph chart of stock market investment trading on white background design. Bullish point vector
    • an abstract illustration of a graph chart vector
    • A glowing blue line chart rises steadily, symbolizing financial growth and upward market trends on a futuristic grid background. , illustration vector
    • business and finance investment. stock market candlesticks and bar chart on blue background vector
    • stock market trend. candlesticks and bar graph on blue background vector
    • finance and business growth. candlesticks chart with bar graph and indicator on blue background vector
    • Business infographic arrow graph vector
      Free
    • Harnessing the Power of Fintech to Revolutionize Business Analysis and Strategy vector
    • a graph showing a downward trend line vector
    • Business candle stick graph chart of stock market investment trading on blue background. Bullish point, up trend of graph. Economy vector design
    • green up bull market trend rising step by step arrow with support lines in transparent chart lines template for business, forex banner background vector
    • Business candle stick graph chart of stock market investment trading on blue background. Bullish point, Trend of graph. Eps10 illustration vector
    • Business candle stick graph chart of stock market investment trading on blue background. Bullish point, up trend of graph. Economy vector design
    • financial line graph chart growth, Investment, stock market on gardient background vector
      Free
    • business bar graph and stock market candlesticks on blue background vector
    • Navigating the Future of Finance Through Technology and Business Analysis vector
    • Line chart clipart. Line graph flat vector isolated on white background. Data analysis, financial report, business analytics illustration. Infographic. Statistics graph. Line chart icon.
    • Trading graph chart of growth or fall in flat design. vector
      Free
    • Business growth chart. Financial trend screen, investment graph and abstract data widescreen charts background vector illustration set
    • Flat budget report. Illustration of infographic business, graph and diagram planning vector
      Free
    • financial chart with up trend line graph vector
    • Stock market Line Chart with Gradient Grey Background vector
    • Light and dark background, Bitcoin crypto currency illustration vector for page, logo, card, banner, web and printing.
      Free
    • bar chartshow stock market price or financial investment profit. business management background concept vector
    • Finance graphs line chart on a blue black grounds tock market vector
    • stock market profit and loss concept vector
    • Glowing vector chart of investment financial data. Infographic elements with glowing elements and mirror effect
    • Light and dark background, Bitcoin crypto currency illustration vector for page, logo, card, banner, web and printing.
    • Graph design on dark blue background. vector
    • Abstract financial chart with uptrend line graph on blue background. vector
    • the graphic Background vector
      Free
    • Businessman flat design, loss and gain on investment, profit or lose money from stock, financial green and red arrow chart concept. vector
      Free
    • abstract financial chart sideways line graph and candlestick on white background vector
    • Abstract financial chart with uptrend line graph on blue background. vector
    • Business candle stick graph chart of stock market investment trading on white background design. Bullish point, Trend of graph vector
    • inger of a businessman. Leading business development vector
      Free
    • Business candle stick graph chart of stock market investment trading on white background design. Bullish point, Trend of graph. Vector illustration
    • arrow white up line trends finance on map vector
    • This simple flat chart displays trend data in a graph format. Trend visualization captures key data points effectively. Ideal for educational purposes, presentations, or business reporting. vector
    • Chart Infographic elements  Business  illustration vector Concept
      Free
    • Light and dark background, Bitcoin crypto currency illustration vector for page, logo, card, banner, web and printing.
    • Investment stock market graph. Arrow growth business chart. Digital report background. Technology graphic vector illustrator.
    • Business candle stick graph chart of stock market investment trading on white background design. Bullish point, Trend of graph vector
    • bar chart with uptrend arrow show  growth of business performance and profit of investment on blue background vector
    • business graph background. stock market candlesticks with bar chart show finance and performance vector
    • abstract financial chart with uptrend line graph and numbers in stock market on gradient white color background vector
    • Economic critical crisis concept. The red graph drops down and charts on a red background. Recession financial, cryptocurrency, gold, and the stock market. Losing money and cash. vector
    • Business candle stick graph chart of stock market investment trading on white background design. Bullish point, Trend of graph. Vector illustration
    • Red arrow graph drop arrow down with bar graph on red background. Money losing. Stock crisis and finance concept. vector
    • economy background. stock market graph with bar chart vector
    • Business candle stick graph chart of stock market investment trading on white background design. Bullish point, Trend of graph. illustration vector
    • Linear Chart Doodle Flat Illustration Icon vector
    • Business candle stick graph chart of stock market investment trading on background design. Bullish point, Trend of graph. Vector illustration
    • Investment stock market graph. Growth business chart. Digital arrow report background. Graphic vector illustrator.
    • Business candle stick graph chart of stock market investment trading on white background design. Bullish point, Trend of graph. illustration vector
    • financial growth chart vector
      Free
    • Monthly growth rate performance over time vector. vector
      Free
    • Financial stock market graph on stock market investment trading, Bullish point, Bearish point. trend of graph for business idea and all art work design. vector illustration.
    • graph show business performance and finance effectiveness on dark blue background vector
    • Template dashboard with mockup infographic, data graphs, charts, diagrams with online statistics and data analytics. Mockup infographic elements for App, dashboard, UI, UX, KIT. Vector graphic
    • Financial stock market graph on stock market investment trading, Bullish point, Bearish point. trend of graph for business idea and all art work design. vector illustration.
    • Futuristic bar chart wallpaper with red and green trend lines. Stock market digital display. Glowing financial static data illustration. vector
    • a graph showing the price of a stock vector
    • Financial stock market graph on stock market investment trading, Bullish point, Bearish point. trend of graph for business idea and all art work design. vector illustration.
    • heart rate monitor graphic background, red yellow green. line vector isolated on black background. modern and simple design
      Free
    • Set of Graphs and Charts. Data and Statistic, Informative Infographics. Vector Illustration.
      Free
    • graph infographic vector, chart business symbol vector
      Free
    • Graph on world map background vector
      Free
    • Digital currency with Candle stick vector
      Free
    • Computer monitor bar and line graph silhouette isolated on white background vector
      Free
    • Pie Graph Graph Graphic Infographic Bright Neon Line Infographic Icon Isolated on Black Background. Diagram chart sign. Colorful outline concept. vector
      Free
    • Pie chart Infographic chart Glowing neon line Infographic icon isolated on black background. Diagram graph sign. Colorful contour concept. blue color. vector
      Free
    • Chart with graph and business growth isolated doodle line art flat illustration on white background. vector
      Free
    • Busket with coin and graph supermarket growth business concept isolated doodle line art flat illustration on white background vector
      Free
    • Hand drawn Money bag with coin and graph isolated doodle line art flat illustration on white background. vector
      Free
    • Graph featuring a prominent dollar sign, illustrating financial trends or data doodle line art flat illustration on white background vector
      Free
    • Financial chart with moving up arrow graph and world map in stock market on blue color background
      Sponsored
    • Graphs, diagrams, parabolas, geometric shapes on Blue green gradient vector background illustration in abstract style. Modern concept for presentation, background for your interface, advertising, text
      Sponsored
    • abstract financial chart with uptrend line graph and numbers in stock market on gradient white color background
      Sponsored
    • financial line chart diagram with ascending graphs on white background,abstract financial chart with sideways line graph and candlestick on white background
      Sponsored
    •  Abstract financial chart with uptrend line graph and numbers in stock market on gradient white color background. Trend lines, columns, market economy information background.  Vector illustration
      Sponsored
    • Abstract grid background with lines and dots. Black grid for motion graphic, VFX tracking markers and video effects. Vector
      Sponsored
    • businessman hand holding tablet  showing graph growth stock. finance forex trading technology. Economy trends investment concept. vector illustration digital design. isolated on blue dark background.
      Sponsored
    • Widescreen abstract financial chart with uptrend line graph and candlestick on black and white color background
      Sponsored